
HINDUNILVR Share Price Target: Here we have divided our analysis into 02 parts:
1: Technical Analysis
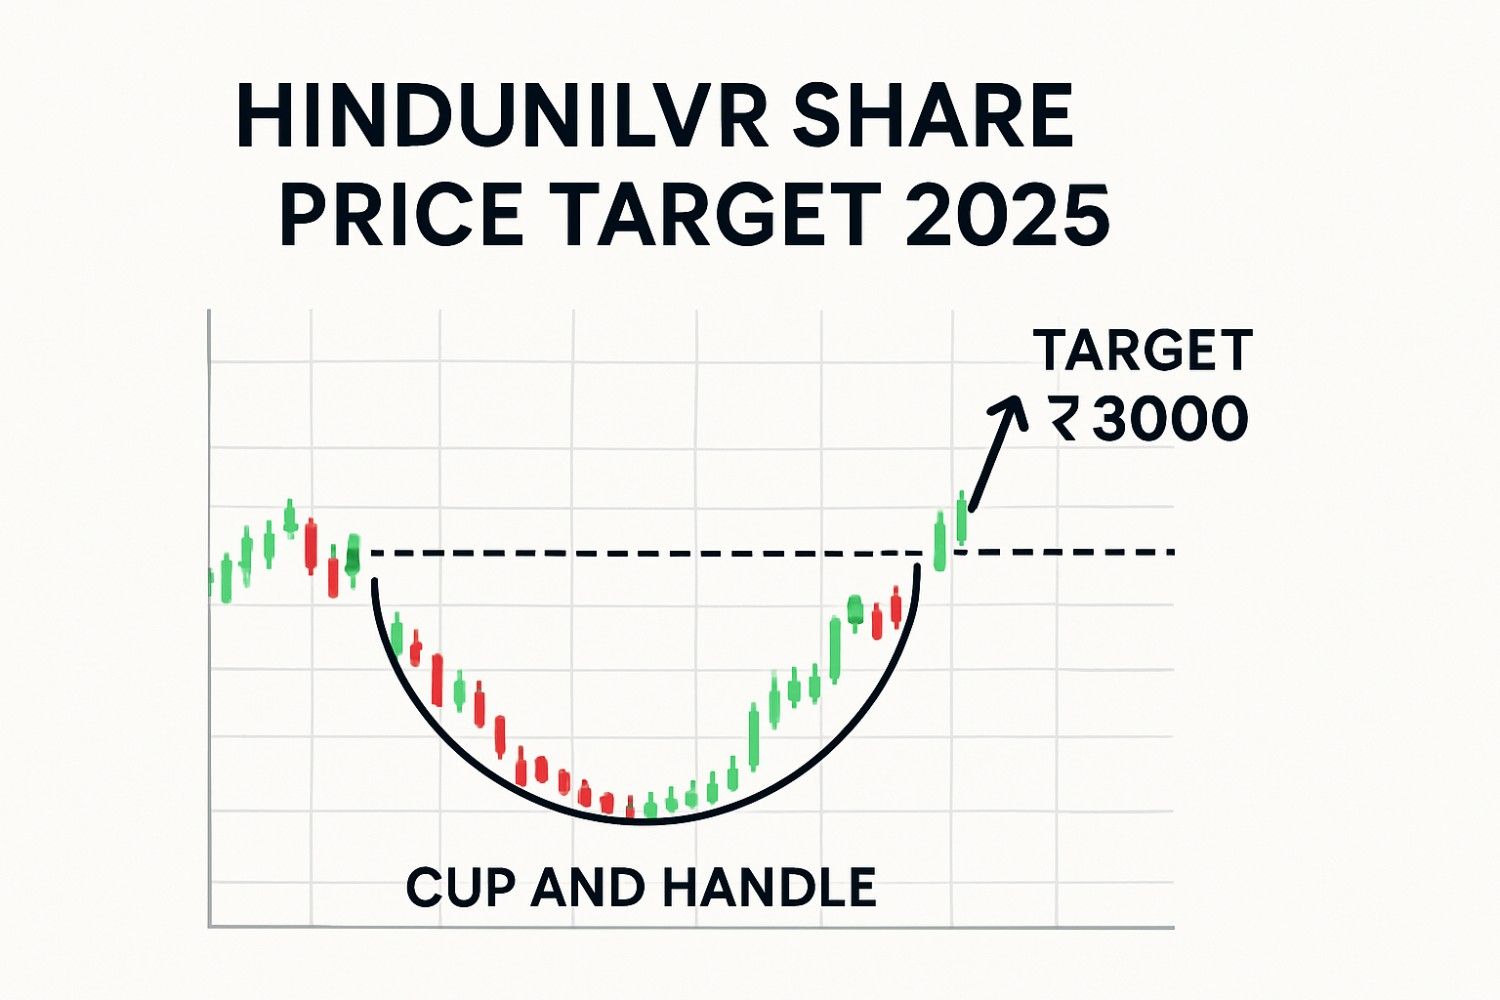
The technical chart of Hindustan Unilever Ltd (HINDUNILVR) displays a cup with handle formation, a bullish continuation pattern closely watched by traders and investors.
-
Cup & Handle Formation:
After a broad decline from its peak (~Rs 3,035), the stock based out, formed a rounded bottom, and consolidated in a pattern reminiscent of a cup. The recent smaller dip and sideways movement marks the handle, which often precedes a major breakout. -
Resistance & Breakout Levels:
-
The Rs 2,586–2,600 zone is the neckline and a key resistance.
-
Sustained price action above this can trigger a follow-through rally, with the next major target near Rs 3,000 and a measured move taking it up to Rs 3,012–3,035.
-
-
Support Zones:
-
Rs 2,400 (200 EMA, red line) and Rs 2,482 (key moving average/volume cluster) serve as strong intermediate supports.
-
A drop below these could delay breakout prospects.
-
-
Momentum & Volume:
The recent upward swing is accompanied by increased participation, suggesting renewed interest from institutional investors. -
Chart Insight:
If the stock closes firmly above resistance with volume, the pathway toward Rs 3,000 is credible, with Rs 3,012–3,035 as the cup’s projected target.
Conclusion (Technical):
HINDUNILVR Share Price Target: The pattern suggests a bullish bias. Confirmation above Rs 2,600-2,586 sets up HINDUNILVR for a possible run to Rs 3,000 in 2025, conditional on overall market sentiment and follow-through buying.
2: Fundamental Analysis
About Hindustan Unilever Ltd (HUL):
HUL is India’s top FMCG giant, operating in Home Care, Beauty & Personal Care, and Foods & Refreshment. With 50+ brands, 9 million+ retail outlets, and manufacturing strength across the country, HUL dominates multiple consumer categories.
Key Business Insights
-
Diversified Segments:
-
Home Care (36% of H1 FY25 revenue): Market leaders like Surf Excel, Rin, Vim; segment grew 32% in two years on volume.
-
Beauty & Personal Care (36%): Brands like Lakmé, Dove, Ponds; 15% revenue growth, supported by premiumization and new launches.
-
Foods & Refreshments (14%): Tea/coffee (Brooke Bond, Lipton), horlicks, Kissan, Kwality Walls, with consistent if slower growth (8%).
-
Export/Other: 3%, focused on cross-border sales and Unilever’s global network.
-
-
Brand Leadership:
-
Holds Top 2 positions in most categories and maintains stable brand power in 75% of its business lines.
-
19 brands with annual sales above Rs 1,000 Cr.
-
-
Innovation & Expansion:
-
Multiple new launches in FY24, premium product focus (25% of revenue from premium).
-
6 global R&D centers, innovation in new-age consumer categories and sustainability.
-
Nano-factories and Lighthouse status (World Economic Forum) for Dapada and Sonepat units.
-
-
Distribution Might:
-
35 hubs, 3,500+ distributors, presence in nearly all of India, 9M+ retail outlets.
-
-
Recent Strategic Moves:
-
Divested Pureit (water business) for Rs 601 Cr to sharpen core focus.
-
Financial Snapshot (as of Aug 2025)
| Metric | Value |
|---|---|
| Market Cap | ₹5,95,551 Cr |
| Current Price | ₹2,536 |
| 52W High/Low | ₹3,035/2,136 |
| P/E Ratio | 56.0 |
| Book Value | ₹210 |
| Dividend Yield | 1.70% |
| ROCE | 27.8% |
| ROE | 20.7% |
| Piotroski Score | 6.00 |
| Industry P/E | 40.9 |
| Reserves | ₹49,167 Cr |
| Borrowing | ₹1,648 Cr |
Growth & Profitability
-
Net Profit (last 5 yrs): ₹7,999Cr → ₹10,671Cr.
-
Compounded Sales/Profit Growth:
-
Sales: 5-year CAGR 10%; TTM 3%.
-
Profit: 5-year CAGR 9%; TTM 3%.
-
-
Stock Price CAGR:
-
10 years: 11%; 5 years: 3%; 1 year: -8%.
-
-
Return on Equity:
-
Last year: 21%; 10-year avg: 29%.
-
Strengths and Risks
-
Strengths:
-
Market dominance and sticky brands.
-
Healthy margins, consistent profit/dividend payout.
-
Debt-light, robust cash reserves.
-
Powerful distribution and innovation engine.
-
-
Risks:
-
Slower growth in recent years—sales & profit growth down to low-single digits.
-
High valuation (P/E 56) vs sector (P/E 40.9).
-
Increasing competition, margin pressures, and demand swings in key categories.
-
Shareholding (Jun 2025)
-
Promoter: 61.90%
-
FIIs: 10.18%
-
DIIs: 15.99%
-
Public: 11.86%
-
Government: 0.07%
Will HINDUNILVR Break Rs 3,000 in 2025?
HINDUNILVR Share Price Target : Technicals support a bullish breakout from a cup with handle, provided Rs 2,600–2,586 zone is surpassed with volume. Fundamentals remain rock-solid in terms of brand, reach, and profitability, but recent growth has slowed and valuations are premium.
A breakout to Rs 3,000 is achievable, particularly if consumer demand revives and HUL succeeds in premiumization and volume-led growth initiatives. As always, investors should monitor quarterly performance and wider FMCG sector trends.
HEROMOTOCO Analysis : see here
For more info Visit : screener.in